Dashboard
Enhance your FauxRPC experience with the interactive dashboard, providing real-time insights into your server’s operations.
To enable the dashboard, simply start FauxRPC with the --dashboard option:
fauxrpc run --schema=service.binpb --dashboard
Access the dashboard in your browser at http://127.0.0.1:6660/fauxrpc.
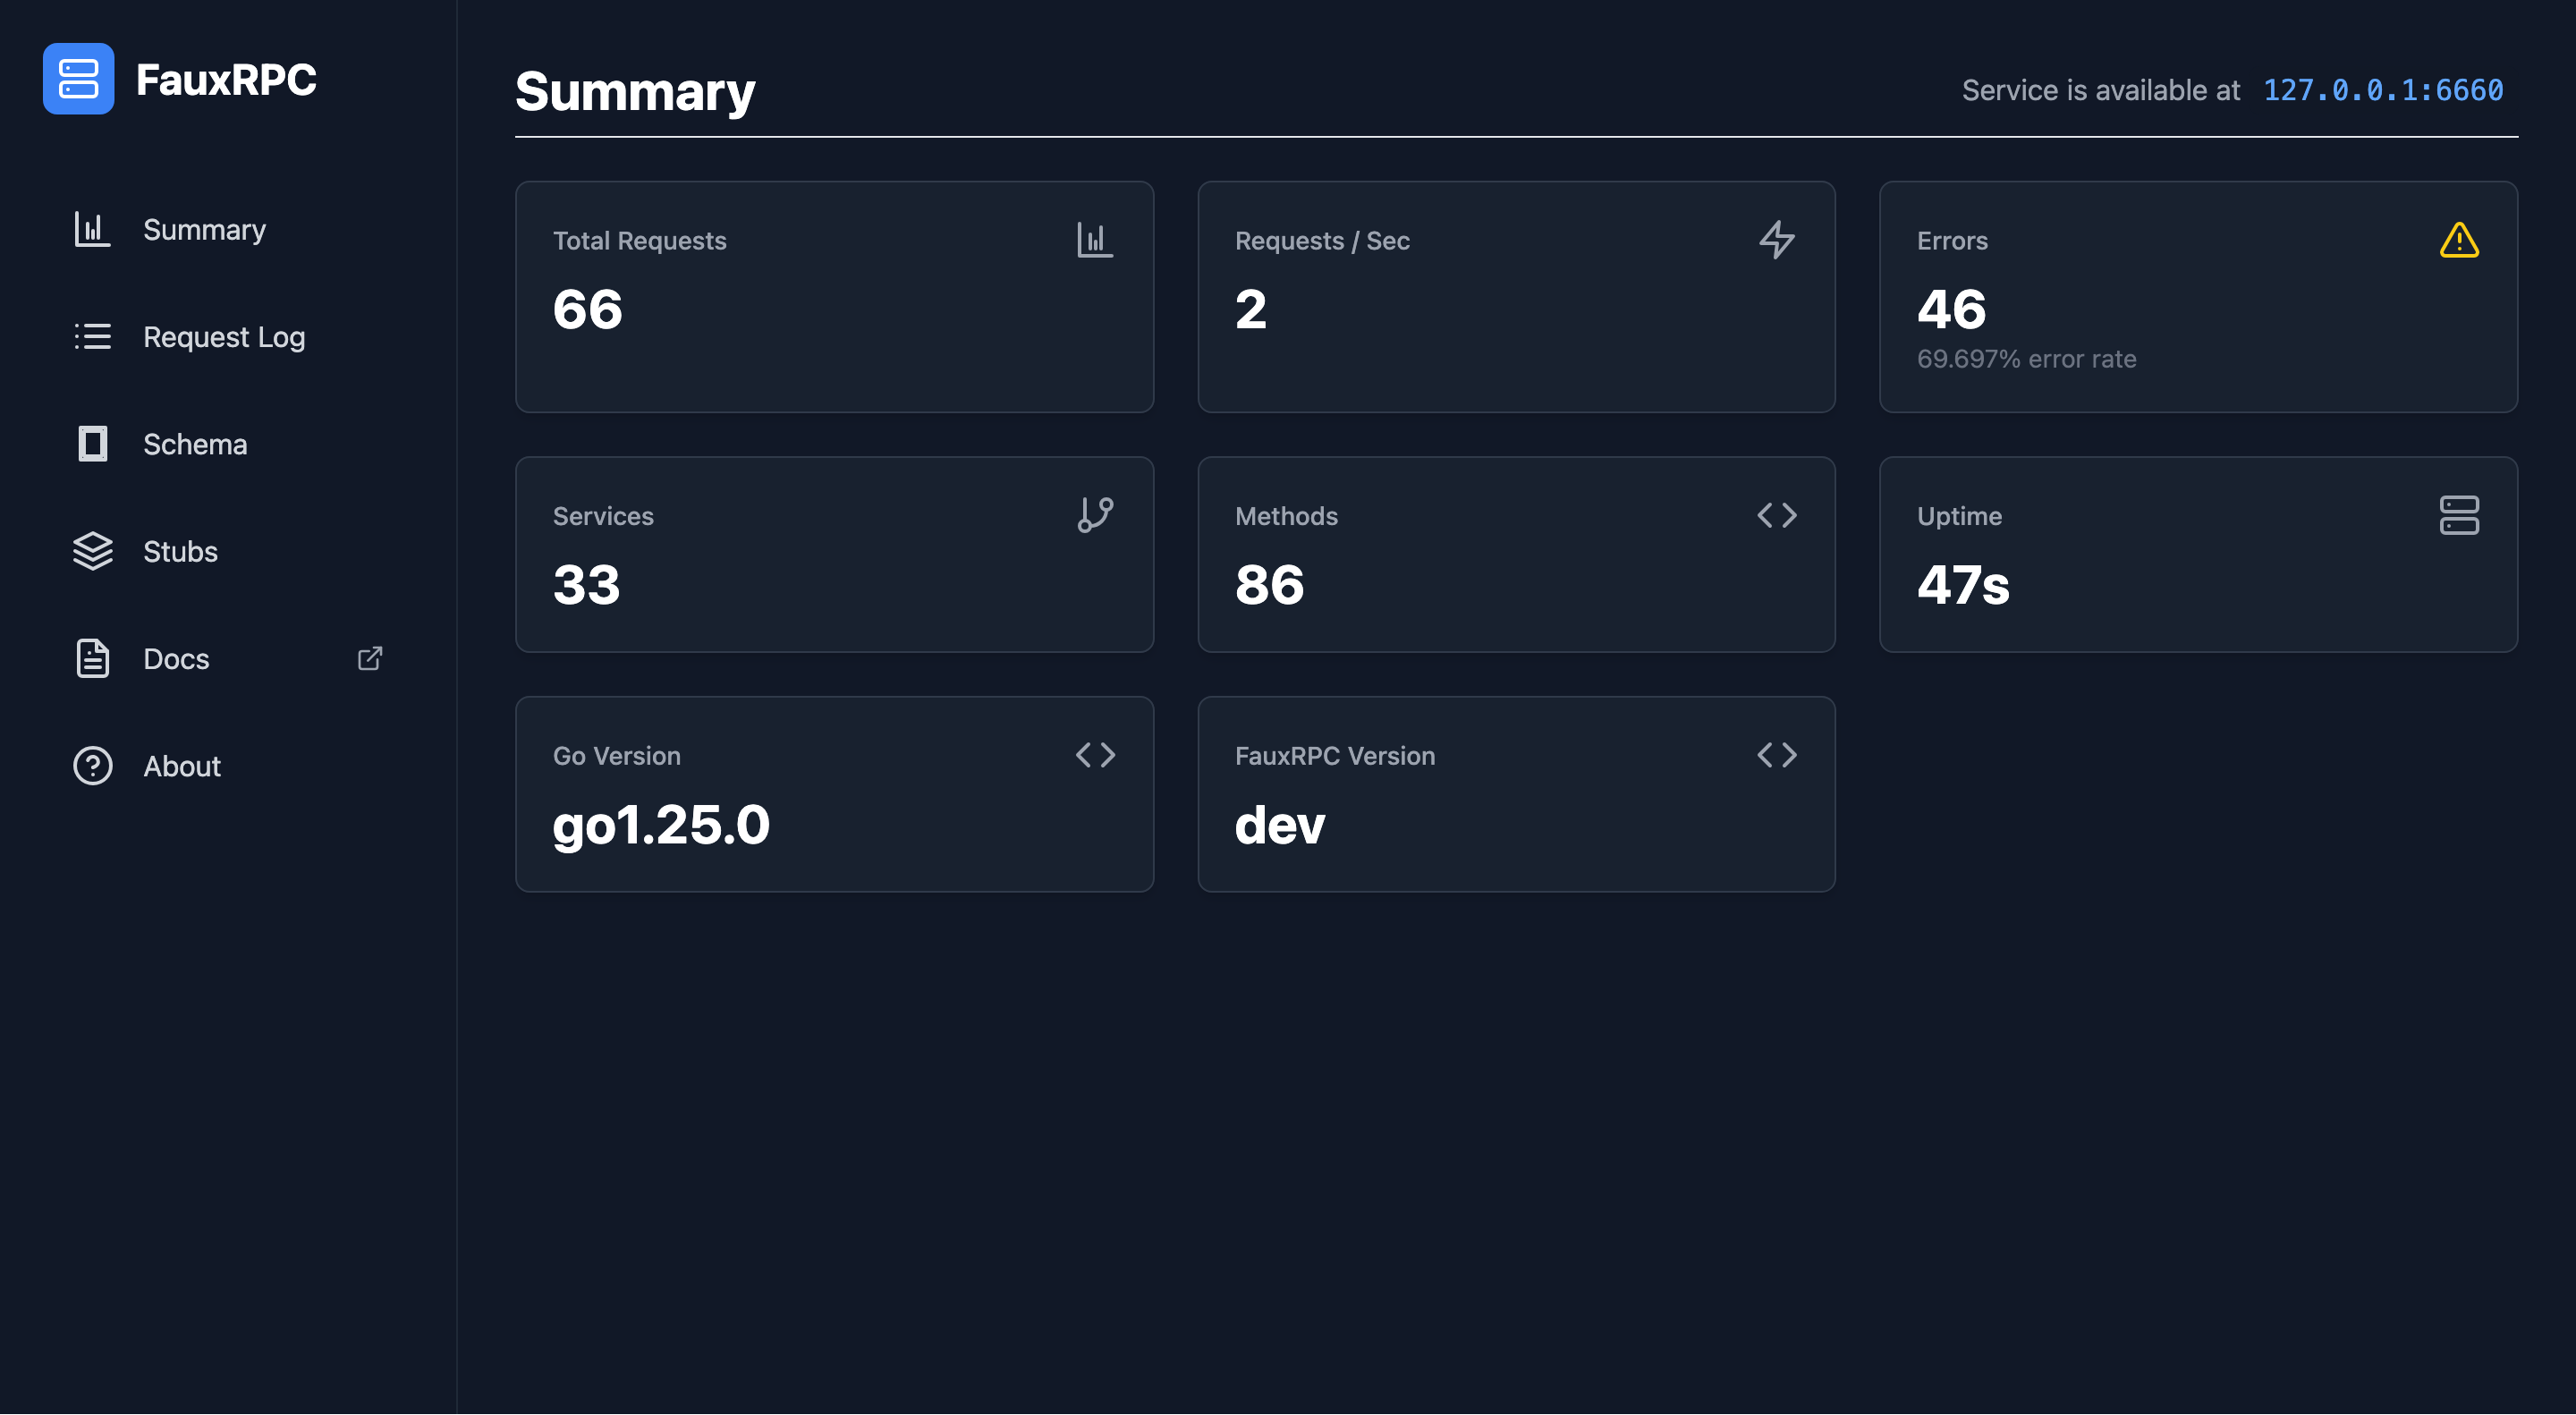
Summary
The summary view provides a high-level overview of your FauxRPC server’s activity. It displays key statistics, such as the number of requests received and the server’s uptime, giving you a quick snapshot of its health and usage.
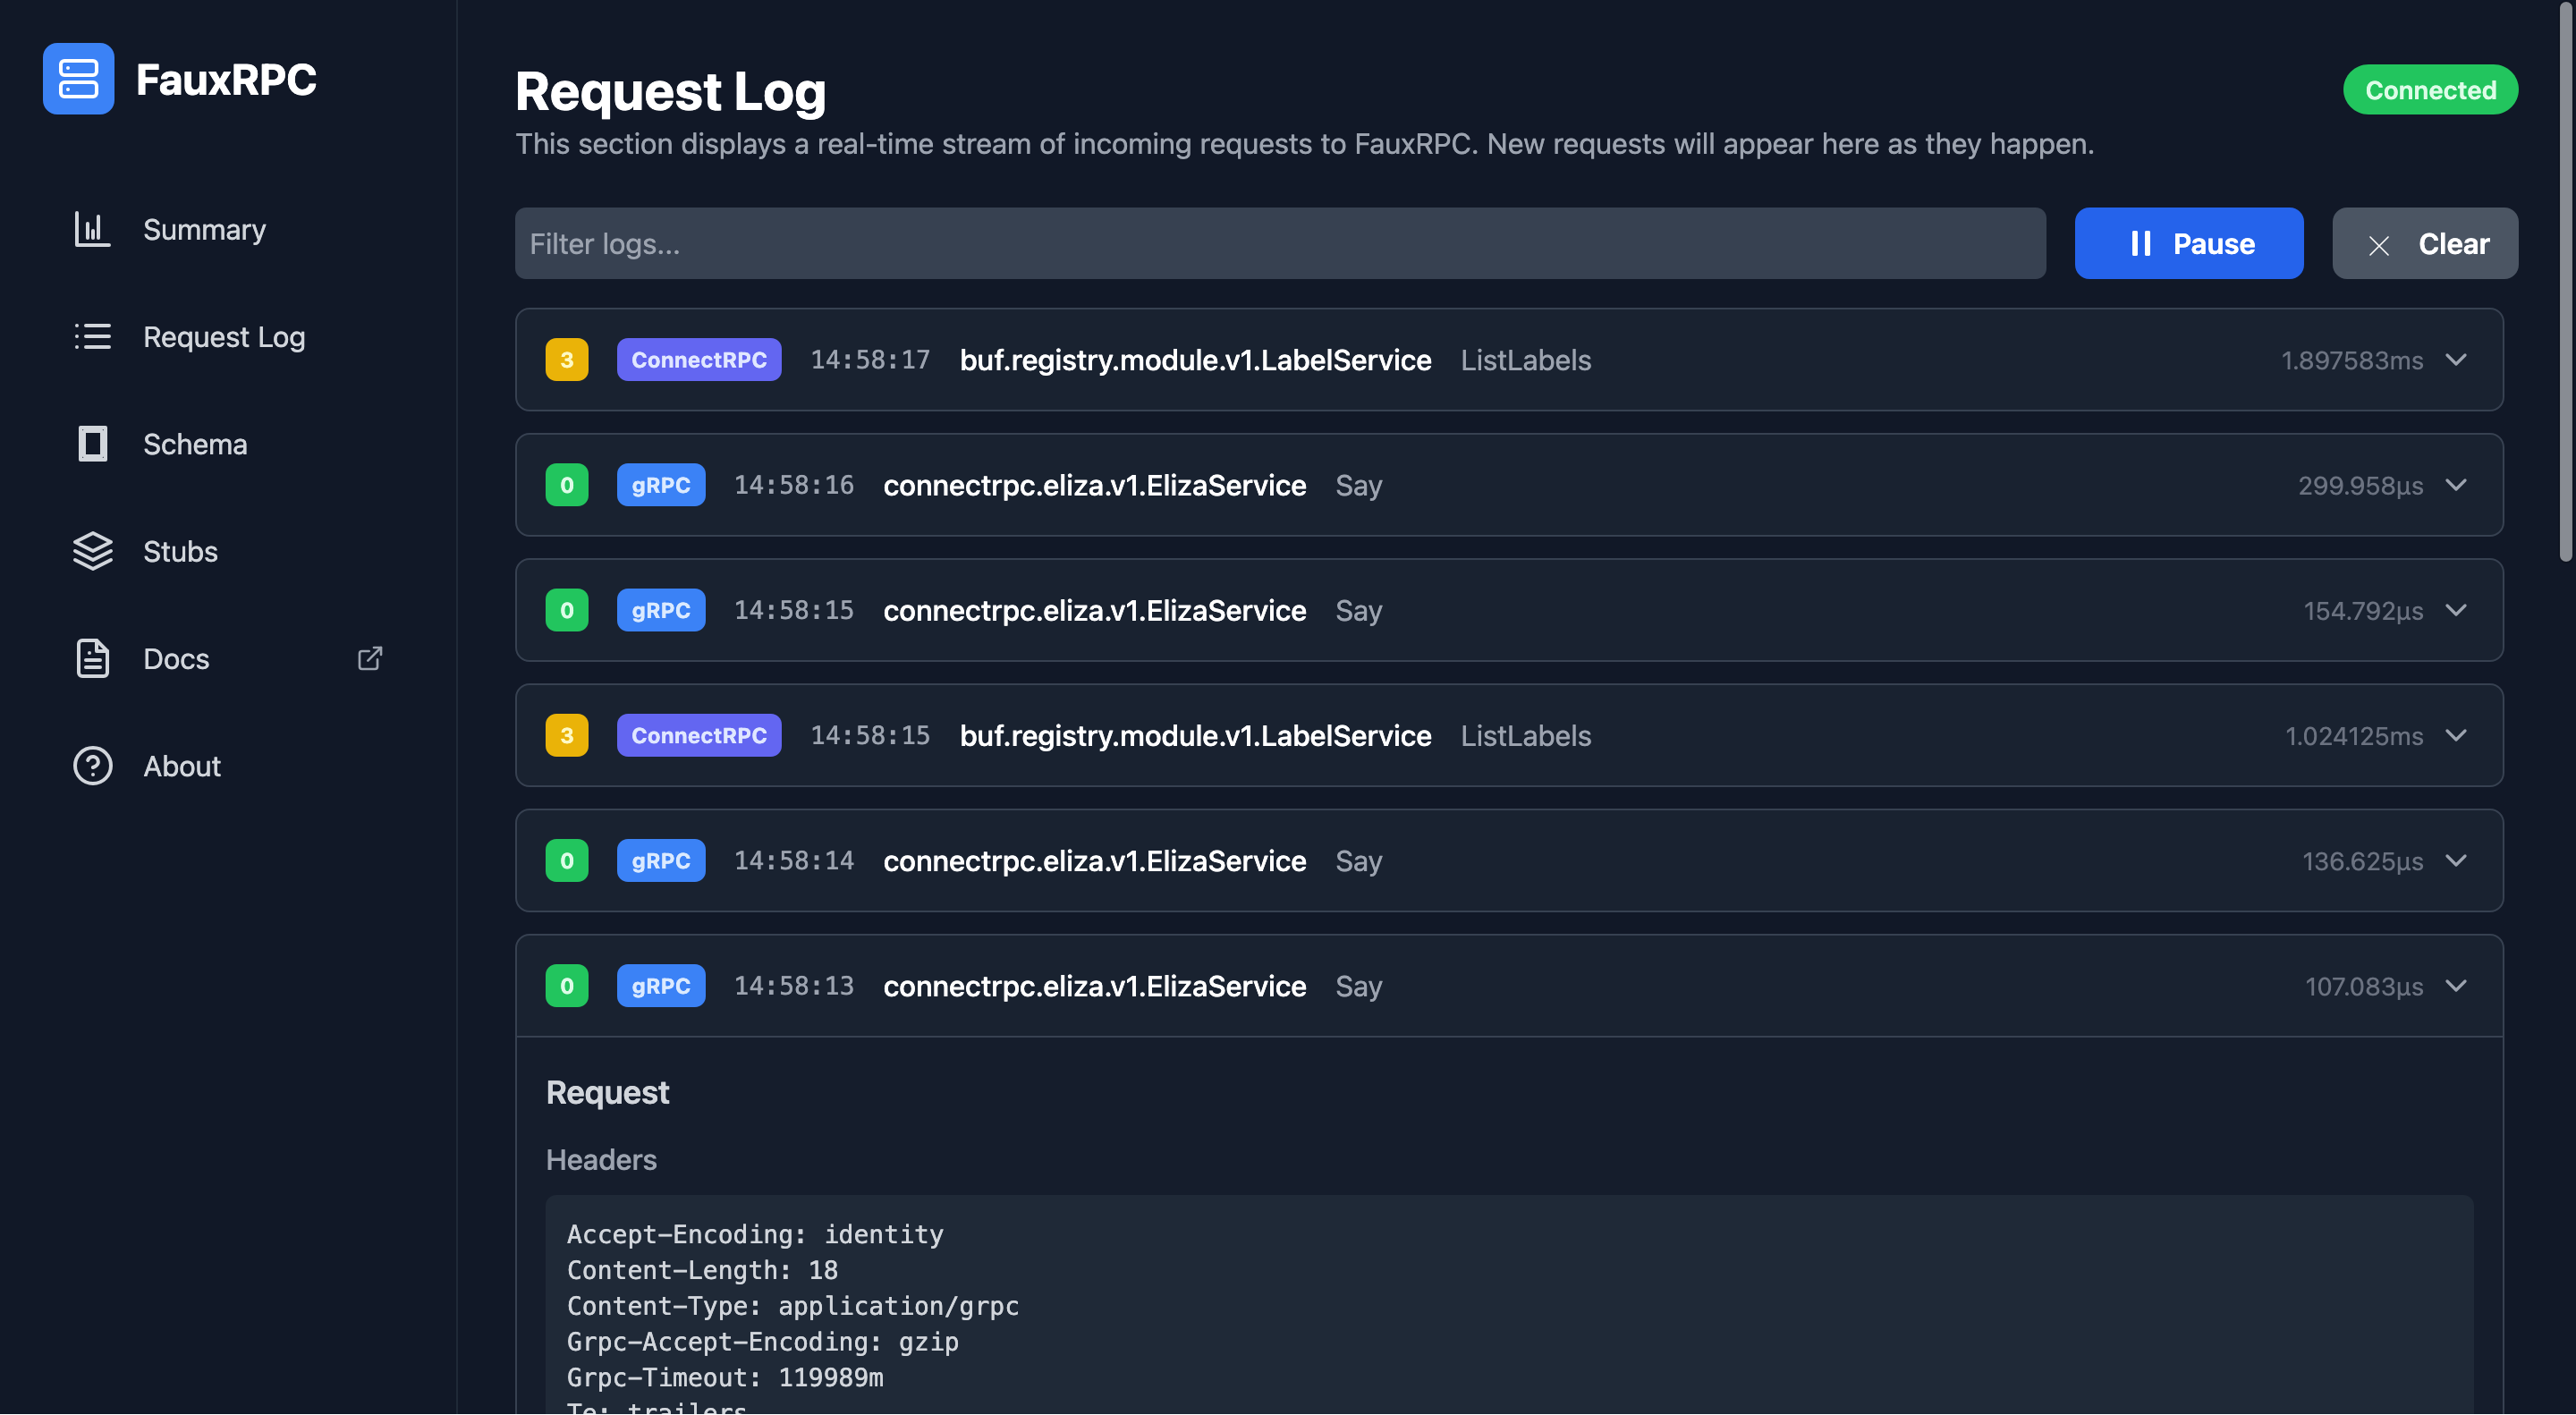
Request Log
The request log offers a real-time, detailed stream of all incoming requests to your server. This is invaluable for debugging and understanding how clients are interacting with your services. You can inspect request headers and bodies, and see how FauxRPC is responding to each call.
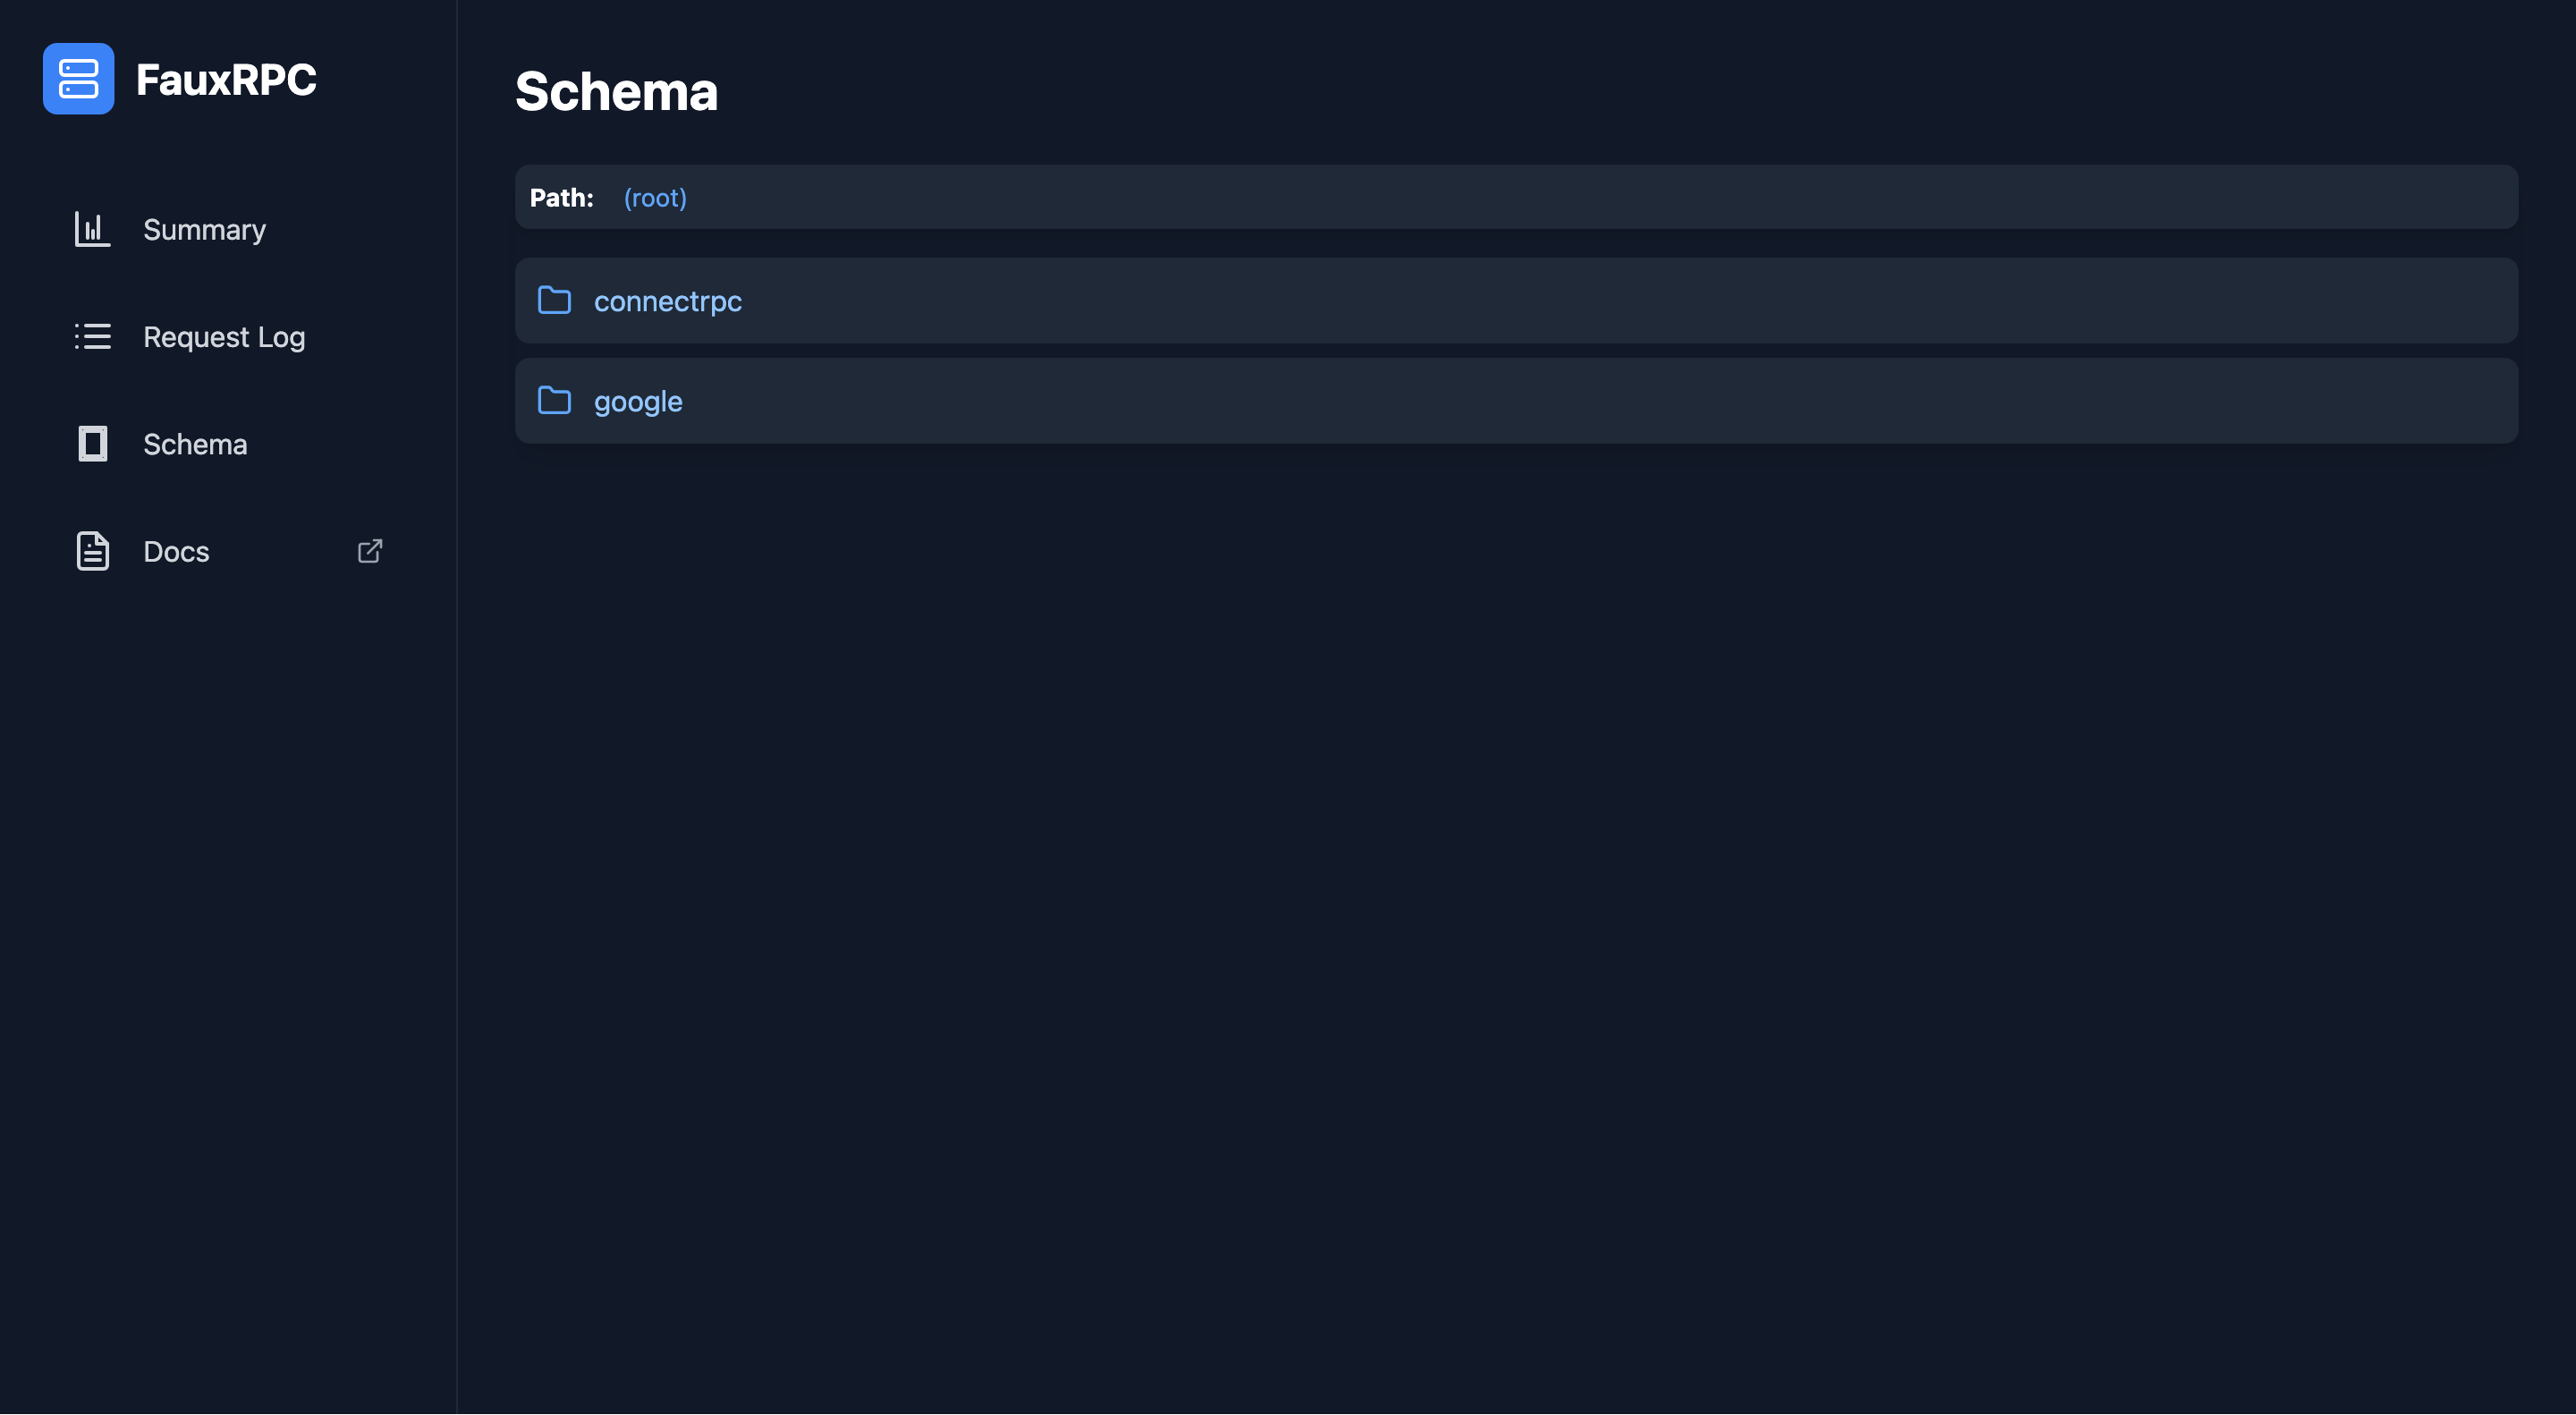
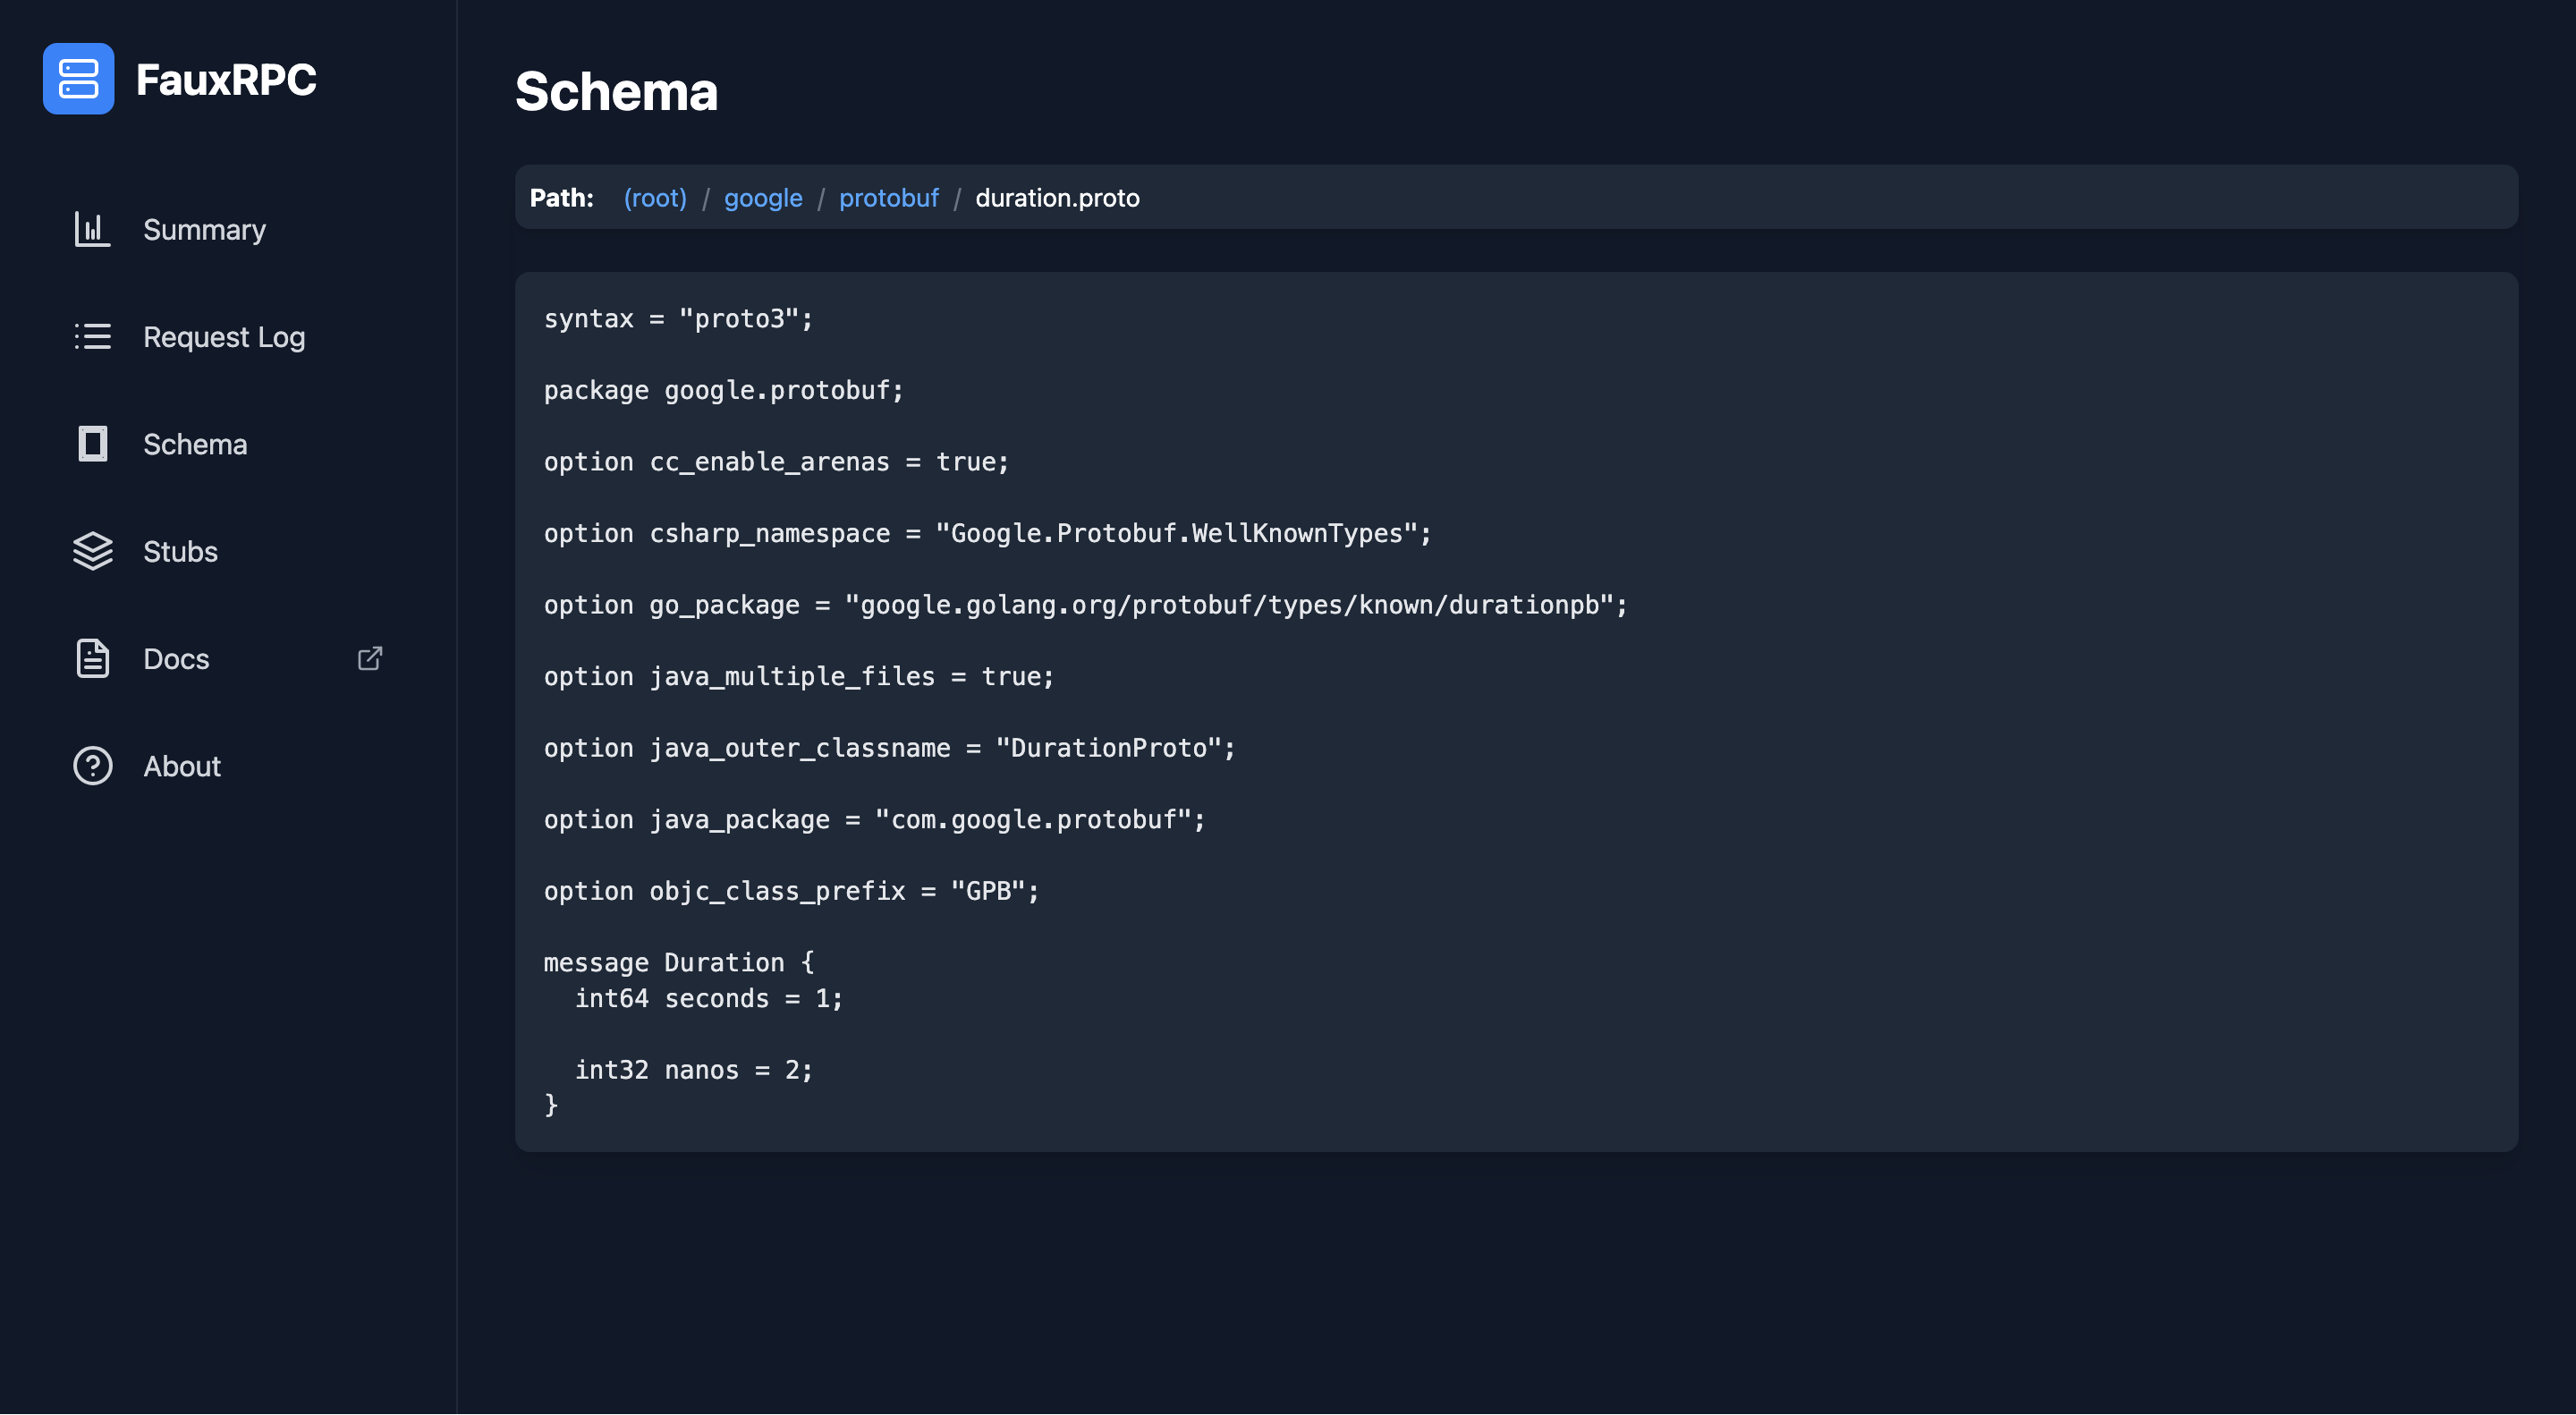
Schema Browser
With the schema browser, you can explore all the Protobuf schemas that are loaded into the FauxRPC server. This feature allows you to navigate through your services, methods, and message types, providing a clear and interactive way to understand your API’s structure. For more details on defining inputs, refer to the Inputs page.
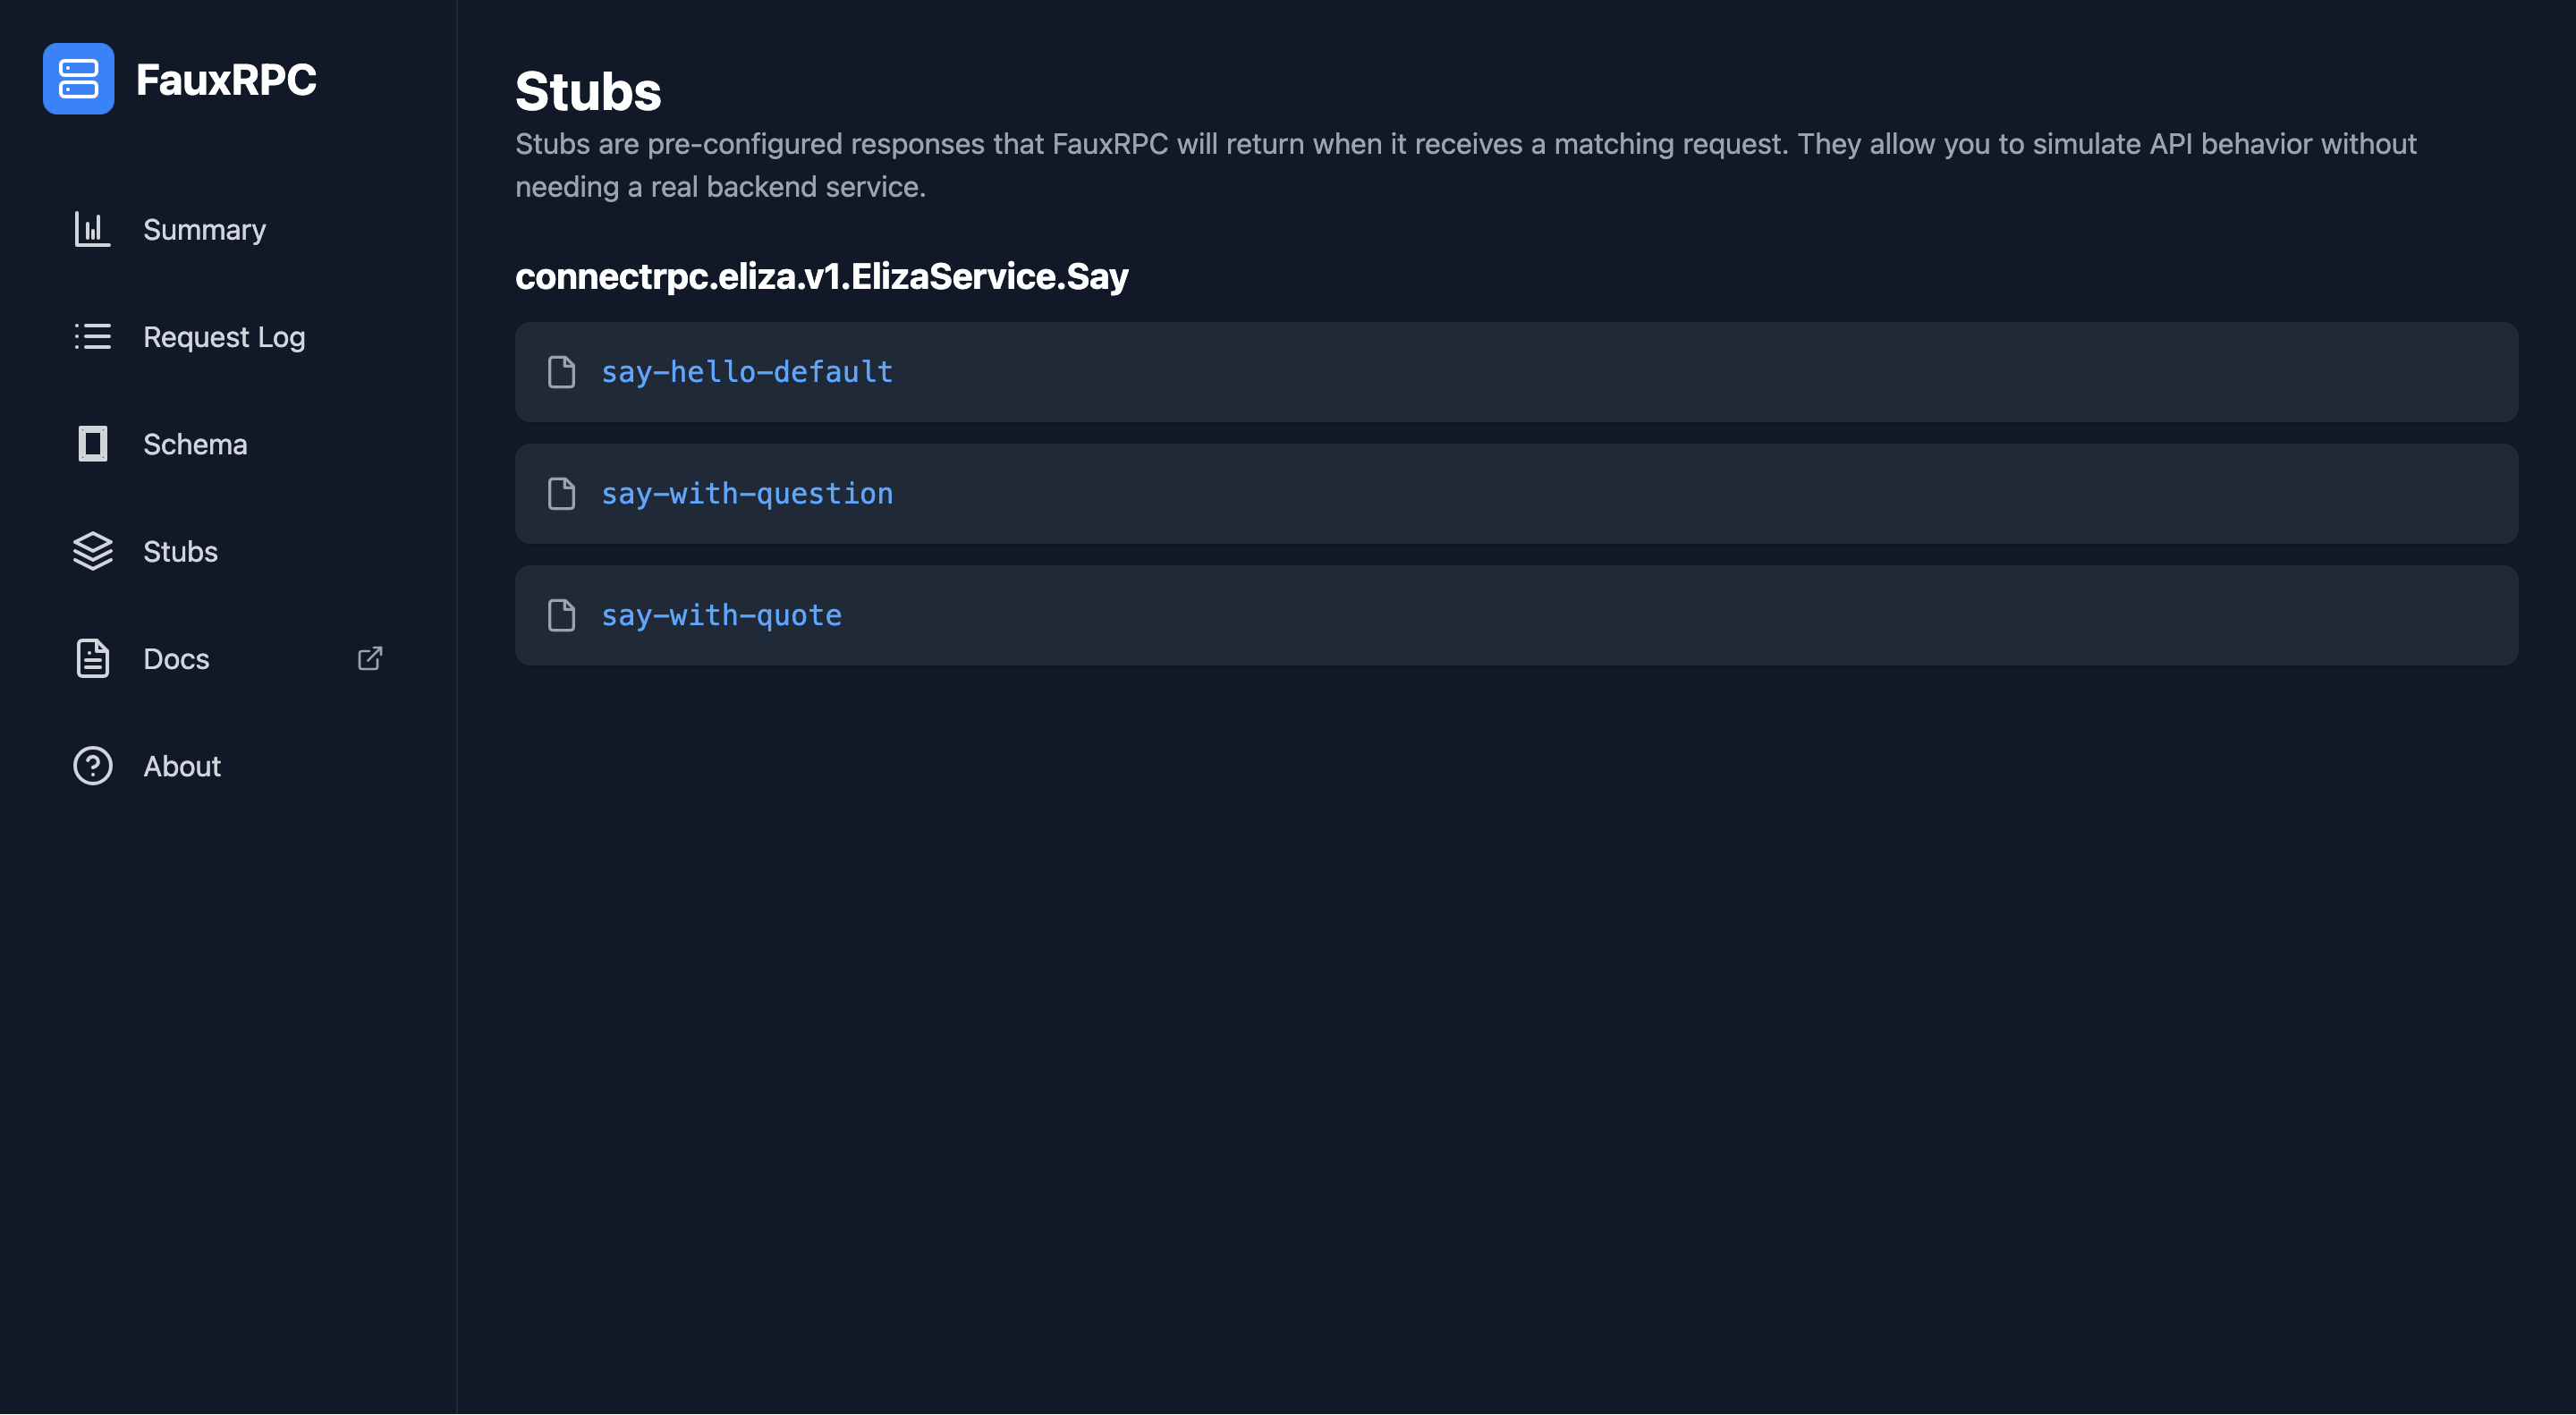
Stubs
The stubs management interface lets you view and manage all the registered stubs in your FauxRPC server. You can see the details of each stub, including its matching criteria and the response it provides. This is essential for controlling the behavior of your mock server. Learn more about stubs on the Stubs page.
API Documentation
FauxRPC automatically generates API documentation from your Protobuf schemas. The dashboard provides a convenient way to access this documentation, making it easy for developers to understand and use your APIs without needing to leave the browser. There are some who use FauxRPC exclusively because it makes displaying protobuf-based API documentations easy.
Last updated 06 Feb 2026, 18:33 +0100 .